
Price is usually the first thing traders look at. It tells you where the market has been and, more importantly, where it is now.
Volume adds another piece to the picture.
It shows how much trading activity took place during a particular period. That can help a trader judge whether a price move attracted broad participation or happened during relatively quiet conditions.
This becomes particularly useful around breakouts, sharp reversals, and major news. A move through resistance during an active session conveys different information than the same move when hardly anyone is trading.
Still, high volume does not automatically make a move genuine, just as low volume does not guarantee a reversal. Volume works better when it is read alongside price.
What Does Trading Volume Actually Tell You?
Trading volume measures how much of an asset changed hands during a given period. Depending on the market and chart, that could mean shares, contracts, lots, or another measure of activity.
If one million shares of a stock trade during a session, its daily volume is one million shares.
The number becomes more useful when there is something to compare it with.
A volume reading of five million shares might be enormous for one company and completely normal for another. Even for the same stock, activity can vary depending on the time of day, earnings releases, or broader market conditions.
That is why traders often compare current activity with an average rather than looking at the raw figure alone.
Reading Price and Volume Together
Price and volume can confirm each other, but the relationship is not as rigid as it sometimes appears in trading guides.
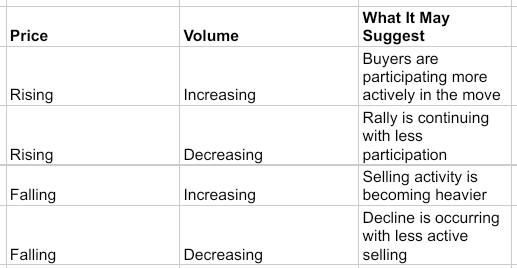
Decline is occurring with less active selling
These observations provide context, not automatic signals.
Take a stock breaking above a resistance level. If trading activity rises considerably at the same time, more market participants are involved in the move. That may give the breakout greater significance.
A low-volume breakout deserves more caution, but it is not automatically false. The asset could simply be trading during a quiet period, or there may be relatively little supply available above resistance.
This is why volume needs context.
Volume Also Affects Trading Conditions
There is another volume side that has little to do with predicting whether price goes up or down.
Execution.
A trader needs someone on the other side of a transaction. Active markets tend to provide more opportunities to match buyers with sellers, while quieter markets can become difficult to trade efficiently.
Liquidity and Execution
Volume and liquidity are closely related, although they are not exactly the same thing.
In a liquid market, orders can usually be executed without moving the price very far. Bid-ask spreads also tend to be tighter, particularly in heavily traded instruments.
Thin markets can behave differently.
Suppose a trader places a relatively large market order in a stock with very little depth available near the current price. The first part of the order may fill at the expected level, while the remainder has to move through several prices before enough counterparties are found.
The difference between the expected execution price and the actual one is slippage.
For a small retail position in a highly liquid instrument, the effect may barely be noticeable. It can become much more important in less liquid assets or during periods of market stress.
Volume Spikes and Volatility
Volume often rises when something gives traders a reason to act.
An earnings surprise can do it. So can an inflation report, central bank decision or unexpected geopolitical development.
More participants enter the market, existing positions are adjusted, and new information has to be reflected in price. The result can be both higher volume and greater volatility.
But one does not necessarily cause the other.
A large amount of trading can occur without an enormous price move if buyers and sellers are relatively balanced. Likewise, an illiquid market can move sharply on fairly modest volume simply because there are not enough orders available to absorb the trade.
That distinction is easy to miss.
Three Volume Indicators Worth Knowing
Raw volume bars already provide useful information, but several indicators reorganize that data to answer more specific questions.
OBV looks at cumulative volume. VWAP asks where an asset has traded on a volume-weighted basis during the session. CMF tries to assess whether activity is leaning more toward accumulation or distribution.
They use the same broad ingredient, but they are not interchangeable.
On-Balance Volume (OBV)
Joseph Granville developed On-Balance Volume around the idea that changes in trading activity can sometimes appear before the full move becomes obvious in price.
Its calculation is fairly simple.
When today’s closing price is higher than the previous close, the session’s volume is added to the running OBV figure. When the close is lower, volume is subtracted. An unchanged close leaves OBV unchanged.
The absolute OBV number is not particularly important. Traders usually care more about its direction and how it behaves relative to price.
Divergences are one common use.
If price continues making lower lows while OBV starts making higher lows, selling pressure may be losing some strength. The opposite situation, with price making higher highs while OBV fails to follow, can suggest that participation in the rally is weakening.
Neither is a reversal signal by itself.
A divergence can persist for quite a while before price reacts, and sometimes it never develops into anything meaningful.
Volume Weighted Average Price (VWAP)
VWAP is particularly common in intraday trading.
Rather than calculating a simple average price, it gives more weight to prices where greater volume occurred.
One reason VWAP matters is its use as an execution benchmark.
Suppose an institution needs to buy a large number of shares over the course of a session. Placing the entire order at once could move the market against it. The order may instead be divided into smaller transactions.
The resulting average execution price can then be compared with VWAP.
For shorter-term traders, VWAP can also provide a useful reference point. Price holding above it may indicate relatively strong intraday conditions, while trading below it can point to weakness.
Calling VWAP a strict dividing line between buyers and sellers would be going too far, though. Price can cross it repeatedly during sideways sessions.
Chaikin Money Flow (CMF)
CMF approaches volume differently.
Developed by Marc Chaikin, the indicator considers where an asset closes within its trading range and combines that information with volume.
A reading above zero generally indicates that price has been closing toward the upper parts of its ranges on relatively stronger volume. Below-zero points indicate the other direction.
Some traders use levels such as +0.10 and -0.10 to filter weaker signals. They should be treated as reference levels rather than universal thresholds.
Different assets behave differently.
Volume Profile Looks at Price Instead of Time
Most volume charts answer the question: how much trading occurred during this candle?
Volume Profile changes the question.
It shows how much trading occurred at each price level over the selected period.
That small change in perspective can be useful when studying areas where the market previously spent a lot of time doing business.
Three terms appear frequently:
- Point of Control (POC): The price at which the greatest amount of volume occurred within the selected profile.
- High Volume Nodes (HVN): Areas containing relatively heavy trading activity. Price may spend more time around these levels as buyers and sellers have previously shown a willingness to transact there.
- Low Volume Nodes (LVN): Areas where comparatively little trading occurred. Price may move through them more quickly, although they should not automatically be treated as breakout zones.
The important word is selected. A Volume Profile changes depending on the period being measured.
A profile covering one session will not necessarily identify the same levels as one covering three months.
What Extreme Volume Can Look Like in Real Markets
Historical episodes help illustrate why unusually high volume attracts attention. They also show why the meaning of a volume spike depends heavily on what is happening around it.
Panic Selling During the Financial Crisis
Trading activity became exceptionally heavy during some of the worst periods of the 2008 financial crisis.
Investors were not simply responding to chart patterns. Financial institutions were under stress, leveraged positions had to be reduced, and some investors were forced to sell.
That distinction matters.
Very high volume after an extended decline can sometimes accompany capitulation, when a large number of remaining sellers exit within a relatively short period. But identifying the exact market bottom from volume alone is nearly impossible.
The 2008 bear market is a useful example. Extreme trading activity appeared during the panic, yet US equities did not establish their eventual bear-market low until March 2009.
High volume showed the intensity of the stress. It did not provide a precise date for the bottom.
GameStop Was Something Completely Different
GameStop in early 2021 had almost nothing in common with a conventional capitulation event.
Trading activity exploded as retail interest in GME increased, and the stock’s unusually large short interest became a central part of the story. Options activity added another layer.
As call-option demand increased, dealers managing those contracts sometimes needed to adjust their exposure by buying the underlying shares. Short sellers closing positions could create additional buying pressure.
Volume became extraordinary as all of these forces collided.
Price eventually moved far beyond levels that traditional fundamental analysis could easily explain.
The episode is useful because it demonstrates what volume actually measures: participation.
It does not tell you whether that participation is rational, sustainable, or based on fundamental value.
Using Volume Without Overcomplicating It
Volume probably works best as supporting evidence.
A few practical checks are enough:
- Breakouts: Compare activity around a breakout with the asset’s recent average. An expansion in volume shows that more participation accompanied the move, although it does not guarantee continuation.
- Exhaustion: A sudden volume surge late in a prolonged trend deserves attention. It may reflect aggressive late participation or position liquidation, particularly when price also shows signs of rejection.
- Price Structure: Look at volume alongside support, resistance, trend direction and the broader market environment. A volume signal becomes easier to interpret when there is already a reason to care about the price level.
- Liquidity: Check whether normal trading activity is sufficient for the size of the position being considered. This becomes particularly important in smaller stocks and less active markets.
There is no need for every volume indicator to agree before entering a trade.
In fact, stacking OBV, CMF, VWAP, and several other volume tools onto the same chart can easily create more noise than useful information. Choosing an indicator that answers a specific question is usually cleaner.
What Volume Can Tell You, and What It Cannot
Trading volume tells you how active a market is.
That sounds simple, but it can add useful context to price. A breakout accompanied by unusually active trading is different from one occurring in a nearly empty market. A selloff with increasing participation deserves different attention from a slow drift lower.
Volume also matters for execution. More active markets generally make it easier to enter and leave positions without accepting large differences between expected and actual prices.
What volume cannot reliably do is tell you what happens next.
High volume does not automatically mean institutions are buying. Every completed trade has both a buyer and a seller. Low volume does not automatically make a rally false, and an extreme spike does not prove that a trend has reached exhaustion.
This is why the indicator becomes more useful when the question is narrow.
Is participation increasing? Did activity expand around the breakout? Where has most trading taken place? Is OBV confirming what price is doing?
Those are questions volume can help answer.
“Will the market go up tomorrow?” is not.
More About Volume
What Is Considered a High-Volume Spike?
There is no fixed threshold. Traders often compare current volume with a moving average, such as the previous 20 periods. Activity two or three times above its recent norm would clearly stand out, but the appropriate comparison depends on the market.
Can Volume Indicators Predict Price Direction?
Not reliably on their own. Volume measures activity and can add context to a move, but price structure, trend, and market conditions are still needed to interpret it.
Is High Trading Volume Always Bullish?
No. Heavy volume can appear during aggressive buying, panic selling, liquidation, or a battle between buyers and sellers. Price behavior provides the missing context.
Which Volume Indicator Is Best?
It depends on the purpose. VWAP is commonly used for intraday price and execution analysis, OBV for cumulative volume trends and divergences, and CMF for assessing buying and selling pressure over a selected period.